
load as pdf
Improving wildlife population density estimation from vertical looking imagery
working paper
by
Jakob Viße (jakob.visse@wildlifemonitoring.eu)
Ulrich Franke (u.franke@aerosense.de)
April, 2020
Cite as:
Viße, J., Franke, U.; 2020; ” Improving wildlife population density estimation from vertical looking imagery “; ScienceSocial.net; ISSN 2366-0104; S2n-20-04-01; https://sciencesocial.net/
Funding Information
This work was prepared for wildlifemonitoring.eu
Copyright
Copyright and all rights are maintained by the author(s). It is understood that all persons copying this information will adhere to the terms and constraints invoked by each author’s copyright. These works may be reposted only with the explicit permission of the copyright holder. Permission is given to duplicate this document for personal use only, as long as it is unaltered and complete. Copies may not be duplicated for commercial purposes.
Content
2.1 Need for wildlife density estimation 5
2.2 Using vertical looking imagery 5
2.3 Advantages over similar methods 6
3 Limitations and sources of error 8
3.1 Error in the study design 8
3.2 Detection error and observer bias 9
4.1 Quantifying study design error 11
4.3 Modelling availability bias 15
5 Modelling spatial distribution of populations 16
In population ecology reliable estimates of animal densities inform thorough wildlife management. A multitude of techniques to obtain estimates accounting for detection probability have been developed. With airborne vertical looking thermal infrared (VLIR) imagery, recent advances in remote sensing technology provide these means. In combination with visual images this allows for animal counts, species identification and density estimation over large areas. However, correctly incorporating detection probability into the models has been an ongoing topic of debate. Here, we propose a survey design using these approaches to address some of the current limitations for estimating wildlife densities using state-of-the-art technology. More specifically, we want to (1) use an established data acquisition method, namely applying a systematic airborne line transect approach with a multi-spectral (thermal infrared, TIR; visual, VIS) camera setup; (2) as a novelty, use manual detections as well as several covariates, e.g. difference of emitted temperature (ΔT) of the animal to the surrounding environment, spatial resolution and vegetation cover derived from the VLIR and visual imagery, to (3) estimate wildlife densities by modelling a corrected detection probability. The proposed model could be used for manned and unmanned (UAS) surveys alike. With this working paper we want to enrich the ongoing discussion and we appreciate your comments. We are open for any kind of cooperation, so do not hesitate to contact us.
Keywords: wildlife monitoring, density estimation, vertical looking, aircraft, covariates, aerial survey, modelling, detection probability, UAS
In wildlife ecology reliable data of animal densities inform the management about ecosystems and populations. Several methods counting aspects of wildlife are established, like direct spotlight or indirect pellet counts or using hunting data. These classical methods are usually used to obtain an index for increasing or decreasing populations in time series. Furthermore, over the decades a multitude of techniques to obtain estimates accounting for detection probability has been developed. For example, in conventional distance sampling (CDS) (Buckland et al. 2015) measures are needed to calculate detection probabilities and, accordingly, animal densities. In general, distances can be derived in various ways such as people walking a transect line or staying at a centre point, driving with a car or a boat, and flying with aircrafts, recording detections and their distance immediately when they occur. As long as measurements are accurate, their exact source is of minor importance. Recent advances in remote sensing technology provide the basis for accurate counts of individual animals (Hollings et al. 2018; Wang et al. 2019). Thus, they offer a promising opportunity to improve existing wildlife population density estimates.
Recently, the potential of synchronously used vertical looking (VL) thermal infrared (TIR) and visual (VIS) imagery has been shown (Franke et al. 2012) and is being used successfully in practice. While TIR facilitates relatively easy detection of animals, visual images provide information about species and other animal characteristics. Furthermore, they offer the possibility of deriving environmental covariates from the imagery at the same time. Detection takes place either immediately or in image post-processing, either manually or (semi-)automated (Hollings et al. 2018; Terletzky and Ramsey 2016).
We have several years of experience applying this technique for estimating ungulate densities in various habitats such as open landscapes, forests and mountainous areas. We analyse synchronous visual and TIR images on two separate screens. Conspicuous heat signatures on the TIR film are verified on the visual image, and – if necessary – further animal characteristics can be derived.
The advantages of airborne monitoring, particularly with manned aircrafts, have been described in detail (Christie et al. 2016). One of its greatest strengths is the acquisition of centimetre scale imagery over large areas (Beaver et al. 2014; Wang et al. 2019). For a recent review of methods to analyse remotely sensed imagery in general, see Hollings et al. (2018).
Visual imagery, which is recorded in the part of the electromagnetic spectrum visible to humans, is being used commonly to count animals. Under suitable conditions, individuals can be clearly distinguished, both against their background environment and each other if they occur in clusters. Potentially, further information can be derived from coat colour or other morphological features such as sex or age. However, bright sunlight, shadows and / or heterogeneous environments can impede or even lead to false identification. Using multiple spectral bands, most prominently TIR, adds further information and improves detection (see Chrétien et al. 2016; Kissell and Nimmo 2011; Millette et al. 2011). TIR light is electromagnetic radiation known as heat. Since all animals lose energy as a result of their metabolisms and thermoregulation, it can be used to detect them via their heat signatures. As with visual imagery, surrounding conditions have to be perfect to allow certain identification (Havens and Sharp 2016). Enhancing factors are contrast to the surrounding, habitat association, temporal exclusivity, coloniality and landscape differentiation. Hindering factors can be, for example, vegetation cover blocking radiation, other heat emitting objects or a small difference to the animal’s surface temperature.
In airborne monitoring, two camera systems are being utilized: forward looking (FLIR) and vertical looking TIR (VLIR). While in the former setup the camera is mounted with an angle from aircraft nadir to the horizon, the latter faces down perfectly vertical. FLIR allows to cover larger areas within an image, whereas VLIR has the advantage to easily calculate linear and area measurements, and has the most consistent pixel resolution across the image (Paine and Kiser 2003).
Recent examples of TIR and / or covariate use have been given for marine mammals (Aniceto et al. 2018; Williams et al. 2017; Young et al. 2019), but also terrestrial species (Carr et al. 2012; Kissell and Nimmo 2011; Schoenecker et al. 2018). They demonstrate in general, the techniques’ potential and advantages such as standardised design; reduced costs (Schoenecker et al. 2018); relatively large areal cover; non-invasiveness; low disturbance; simultaneous generation of up-to date habitat information. However, the approaches differ in detail about assumptions they make, and owing to specific ecosystem and animal characteristics. Although the method produces robust density estimates, some yet unresolved issues remain.
Similar to other monitoring approaches, study design choices depend on the desired output. The size of the Study area determines if a survey on foot, via Unmanned Aerial Systems (UAS) or aircraft is most feasible. We are generally interested in improving the use of VL imagery for wildlife density estimation, namely assessing and correcting for the different errors inherent to it.
One potential source of error lies in the study design. This aerial design error might lie in the layout, i.e. length, width and density of flown strip transects. Nevertheless, if transects overlie the study area in a systematic manner, with the first transect randomly placed, the assumption of a representative sample can be met. Furthermore, transects are then assumed to be independent of animal locations (Buckland et al. 2001). So far, we could not recognise any responsive movement in our aerial surveys (flying 400-600 m above ground) allowing us to detect the animals at their initial position. Therefore, double counting does not affect our density estimation. In summary, study design should be thoroughly chosen according to local study area, population and available resources.
In general, two types of detection bias exist: false-negative errors, i.e. missed detections of animals; or false-positive errors, i.e. detections through misidentification or double counting (Brack et al. 2018). Further sources of detection bias comprise clustering, since aggregations of animals are more conspicuous; age, because young individuals are smaller and often have camouflage coats; or environmental factors such as vegetation, particularly by coniferous trees, or topography cloud cover (LaRue et al. 2017).
Distance sampling methods assume a varying probability of detection depending on some measure, usually the distance from a line transect or sample point in CDS (see Buckland et al. 2001). For line transects, the assumption of a uniform distribution of animals with regard to the line has to be met, for example by placing transects equally spaced into the study area. For VL imagery, analogue to CDS, Schoenecker et al. (2018) present another idea how to meet the assumptions of reduced detection probability with increasing distance from the centre line. They use an unaltered uniform model, assuming perfect detectability across the imagery, with detection probability likely decreasing radially from the image centre due to blind spots (cf. Kissell and Nimmo 2011). On the other hand, Millette et al. (2011) did not find such a parallax effect in their study. Especially with the use of small strip widths of about 80–150 meters, we do not see a correlation between detection probability and distance to the centre line (Deuker and Franke 2015).
Moreover, some authors argue that the application of airborne monitoring for detecting wildlife is restricted by size, shape and further animal characteristics, for example contrast to the surrounding. This can possibly be more important than spatial resolution (Laliberte and Ripple 2003). In particular cases a multi-species approach is desired (e.g. Chrétien et al. 2015). Here, misidentification between similar species can be a problem, but more prominently for automated counts without post-checking (Brack et al. 2018). However, at wildlifemonitoring.eu we are able to manually distinguish different large ungulate species from TIR and VIS imagery.
A third source of bias lies in the availability of animals for detection, namely if they are available to count when the aircraft flies over them. The term is not always clearly separated from detection bias, but Brack et al. (2018) offer a definition, referring to it as unavailability for detection due to animals being submerged or hidden below vegetation. For our aerial surveys, animals might only be unavailable for detection while standing under dense coniferous trees, where detection probability is zero. Furthermore, availability can be a function of habitat use and so, indirectly, environmental factors as well. One can account for this in the study design, for example by using auxiliary information such as telemetry data, double observer methods, or sophisticated modelling techniques (e.g. Williams et al. 2017). However, acquiring additional data or using double observer methods like tandem flights can increase overall costs dramatically.
Here, we propose an improved systematic survey design for wildlife population density estimation using VL imagery from aerial systems, which can be manned or unmanned. The combination of recent technology and statistical modelling techniques, in our opinion, is highly suited to achieve this. Furthermore, we stress the collaboration of experts in the fields of wildlife ecology and monitoring, remote sensing, and statistics to achieve the best possible method.
In comparison to distance sampling from vehicles or telemetry studies, airborne approaches pose relatively little stress to the animals. Nevertheless, there is vast literature about responses of wildlife towards human disturbances (e.g. Enggist-Diiblin and Ingold 2003; Frid and Dill 2002; Hamr 1988; Gander and Ingold 1997). Species react differently both qualitatively and quantitatively. Presumably, there are also differences between populations, e.g. hunted vs. non-hunted, or depending on habituation to humans in general (Gill et al. 1997; Jayakody et al. 2008; Sibbald et al. 2011; Tablado and Jenni 2017). We are aware of it and incorporate them into monitoring by adjusting flight time or height.
More specifically, we aim at using our established survey design (cf. Franke et al. 2012) to receive a representative sample of the study area of interest. To assess the robustness of our method we suggest a resampling approach, randomly drawing a proportion of our sampled strip area, divided into equally sized segments. Thereby, we can quantify the variation in the sampling process as a measure for the robustness of the method. Having access to a large data base of image material, we can use subsamples from the same study or data from different areas.
The use of airborne camera systems produces large amounts of video and image material that needs to be scanned for animal detections. Especially, since UAS are becoming more accessible and, thus, approaches to automatize the material have been developed accordingly (Chabot and Francis 2016; Chrétien et al. 2015, 2016; Conn et al. 2014; Hollings et al. 2018; Seymour et al. 2017). For our purposes (i.e. heterogeneous habitat, small animal clusters or individuals, etc.) manual counts proved the most reliable. Nevertheless, with algorithms being improved and increasing training data, we follow the development with interest. Since the raw data is stored on hard drives, it can be investigated post-hoc multiple times or by different analysts and, thus, allows for some correction of observer bias. For example, Buckland et al. (2012) tested it using randomised double-blind reviews of a certain proportion of their raw data. Agreement between individual reviews was more than 90% in their study.
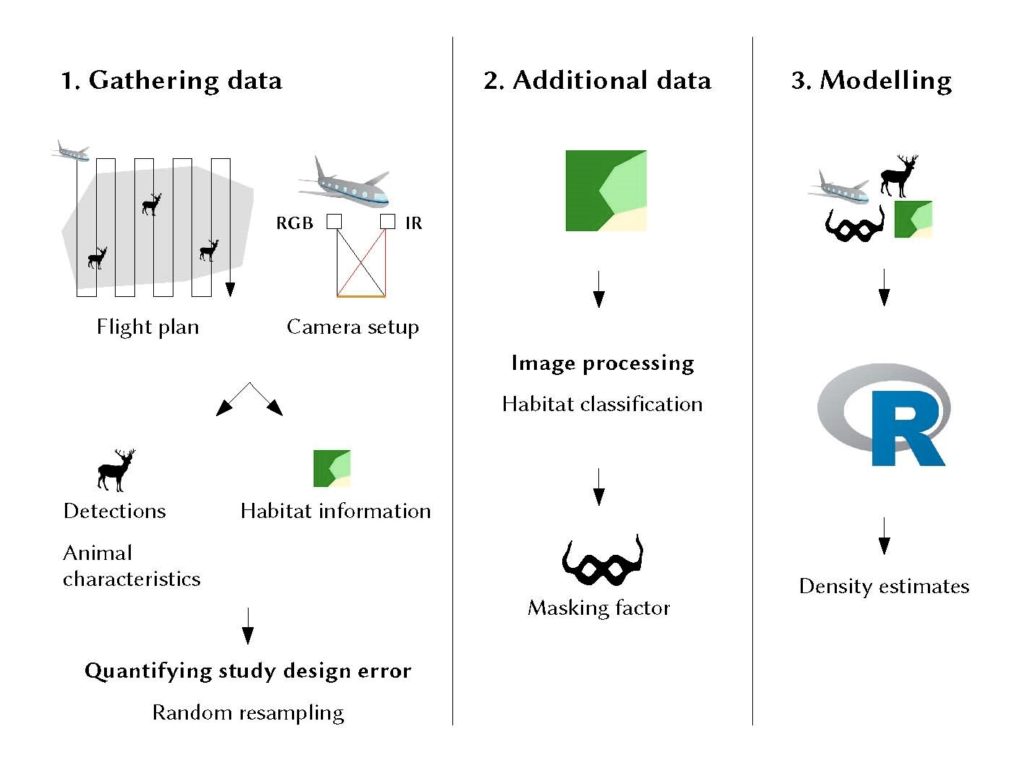
Figure 1: Diagram showing the three-step workflow of our proposed method: (1) In a standardised line transect survey we use a dual setup of TIR and VIS cameras for detecting and identifying individual animals and derive further characteristics as well as information about the habitat. (2) We also use habitat data for calculating a masking factor as measure for detection probability. (3) All data as well as technical details about the flight and the images are finally used to model population density accounting for imperfect detection of the animals.
We want to model probability of detection as a function of masking and additional covariates, similar to multi-covariate distance sampling (MCDS) (Marques et al. 2007). According to the authors, its main use is to increase reliability of density estimates made on subsets of the whole data to increase precision of density estimates or to allow inferences about the covariates. Density estimates are then supposed to be calculated from statistical modelling, accounting for several covariates likely to affect detection probability (Table 1). These are going to be derived from the imagery at the same time, complemented by aircraft, weather and elevation data.
For VLIR imagery, deriving a masking factor as measure of detection probability has been proposed (Beaver 2011; Franke et al. 2012). In our method the masking factor is represented by the vegetation cover. The method assumes perfect detection without any masking, as well as masking independent of animal distribution. While the former can be met by flying under perfect conditions (Bernatas and Nelson 2004; Millette et al. 2011), the latter has to be carefully ensured considering species and study area. As a measure for detection probability we want to use the masking factor, here vegetation cover and environmental conditions affecting sight ability derived from available TIR and VIS imagery, as well as further variables (Beaver 2011; Deuker and Franke 2015; Franke et al. 2012). They can be included as covariates into a sight ability model (Kissell and Nimmo 2011; Samuel et al. 1987), namely a logistic regression model with a binary response (detected/undetected), which can be used to correct total counts.
Thereby, we want to close gaps in the methodology, e.g. derive improved correction factors for detection probability in closed landscapes such as forests (cf. Carr et al. 2012; Samuel et al. 1987).
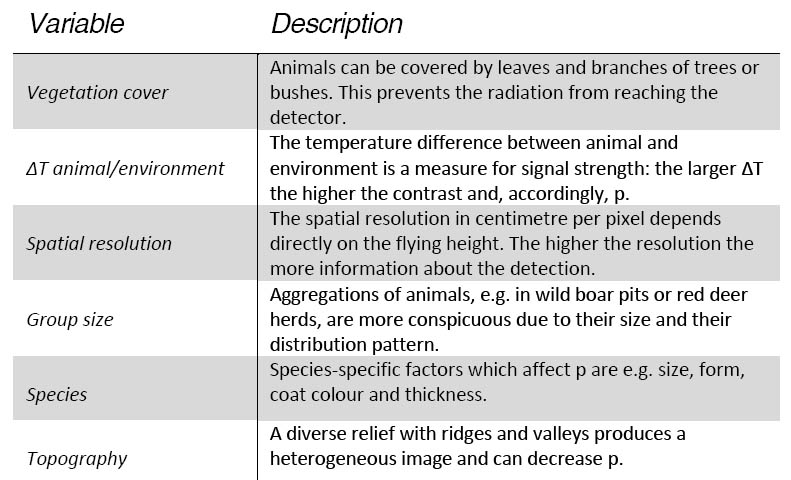 Table 1: Parameters affecting the detection probability p of wildlife on airborne imagery. ∆T describes the difference between surface temperature of the animal and the surrounding background in °C.
Another potential source of error poses the availability for detection. Assuming the process of estimation is sound in itself, availability can be assessed, for example, via ground observers (Hodgson et al. 2017), study designs with known abundance (Chrétien et al. 2016; Conn et al. 2014), or telemetry data (Conn et al. 2014; Martin et al. 2012). In addition, temporally replicating flights can address availability bias without the need for additional data (Brack et al. 2018; Kilburn 2018; Williams et al. 2017; Yamaura et al. 2011). Still, intervals have to be chosen carefully, being large enough to allow for a change in availability state but also short enough to meet the population closure assumption. Moreover, repeated flights increase costs and capture for telemetry exposes the animals to stress. Therefore, the appropriate method has to be chosen carefully, depending on objective and resources.
For our purposes, in case of a detection probability of p = 0, e.g. under dense coniferous forest, we want to use telemetry data to model the use of space / habitat and repeat the process with the aerial data. By comparing the ‘terrestrial’ to the ‘aerial’ habitat use model, we want to find out whether or to which extend ‘availability’ (p=0) biases our counts. If, for example, the terrestrial model documents that at the time of the aerial survey 70% of the GPS collared animals use dense coniferous forests, but in the aerial model only 10% of the detected animals were found in this habitat, we could use this information to correct our estimate.
For cases when abundance and spatial distribution of a population are of interest, one can use a density surface model (DSM) (Miller et al. 2013), which consists of a spatial model of the abundance of a biological population that has been corrected for uncertain detection via distance sampling methods. DSM focus on model-based inference facilitating to extrapolate to a larger study area. An important assumption of this approach is that distances do not contain total information about the spatial distribution of animals. In a two-stage procedure, (1) a detection function is fitted and counts summarised per segment (i.e. contiguous, homogenous transect section), and (2) a generalised additive model (see Wood and Augustin 2002) is fitted for each segment, with counts as response variable and covariates as predictors. Furthermore, DSM allow to incorporate structures accounting for spatial autocorrelation into the model (Miller et al. 2013). Since images are recorded consecutively, they are not independent from each other. Close images are presumably more similar in their environmental conditions than those further away from each other.
In summary, we would like to test if these models, adapted to our method, could be used to provide more detailed information about the study population. The statistical computation software R provides several packages for these tasks, e.g. Distance (Miller et al. 2019) and DSM (Miller et al. 2017). Moreover, it has comprehensive data transformation and visualisation capabilities, useful for data preparation and presentation.
We are convinced that our research has significance for at least two reasons. First, improved density estimates offer the possibility of a better understanding about the relationship between habitat, animal and the detection process. We might answer follow-up questions regarding the suitability of certain areas for wildlife, but also, for example, how species differ in relation to detection. Second, refining the methodology is the first and crucial step towards developing a complete workflow, from planning the study design to the final modelling process. We are confident that once such a framework becomes more widespread it can help making well-informed management decisions such as improved shooting plans.
A. S. Aniceto, M. Biuw, U. Lindstrøm, S. A. Solbø, F. Broms, and J. Carroll. Monitoring marine mammals using unmanned aerial vehicles: quantifying detection certainty. Ecosphere, 9(3): e02122, Mar. 2018. ISSN 21508925. doi: 10.1002/ecs2.2122. URL http://doi.wiley.com/10.1002/ecs2.2122.
J. T. Beaver. An evaluation of population estimators and forage availability and nutritional quality for white-tailed deer in Tennessee. Master Thesis, Dec. 2011. URL https://trace.tennessee.edu/ utk gradthes/1057.
J. T. Beaver, C. A. Harper, R. E. Kissell, L. I. Muller, P. S. Basinger, M. J. Goode, F. T. Van Manen, W. Winton, and M. L. Kennedy. Aerial vertical-looking infrared imagery to evaluate bias of distance sampling techniques for white-tailed deer. Wildl. Soc.Bull., 38(2):419–427, June 2014. ISSN 19385463. doi: 10.1002/wsb.410. URL http://doi.wiley. com/10.1002/wsb.410.
S. Bernatas and L. Nelson. Sightability model for California bighorn sheep in Canyonlands using forward-looking infrared (FLIR). wbul, 32(3):638–647, Sept. 2004. ISSN 0091-7648, 1938-5463. doi: 10.2193/0091-7648(2004)032[0638:SMFCBS]2.0.CO;2. URL https://bioone.org/ journals/Wildlife-Society-Bulletin/volume-32/issue-3/0091-7648(2004)032[0638:SMFCBS]2. 0.CO;2/Sightability-model-for-California-bighorn-sheep-in-canyonlands-using-forward/10. 2193/0091-7648(2004)032[0638:SMFCBS]2.0.CO;2.full.
I. V. Brack, A. Kindel, and L. F. B. Oliveira. Detection errors in wildlife abundance estimates from Unmanned Aerial Systems (UAS) surveys: Synthesis, solutions, and challenges. Methods in Ecology and Evolution, 9(8):1864–1873, Aug. 2018. ISSN 2041-210X. doi: 10.1111/2041-210X. 13026. URL https://besjournals.onlinelibrary.wiley.com/doi/full/10.1111/2041-210X.13026.
S. T. Buckland, D. R. Anderson, K. P. Burnham, J. L. Laake, D. L. Borchers, and L. Thomas. Introduction to distance sampling estimating abundance of biological populations. 2001.
S. T. Buckland, M. L. Burt, E. A. Rexstad, M. Mellor, A. E. Williams, and R. Woodward. Aerial surveys of seabirds: the advent of digital methods. Journal of Applied Ecology, 49(4):960– 967, 2012. ISSN 1365-2664. doi: 10.1111/j.1365-2664.2012.02150.x. URL https://besjournals. onlinelibrary.wiley.com/doi/abs/10.1111/j.1365-2664.2012.02150.x.
S. T. Buckland, E. A. Rexstad, T. A. Marques, and C. S. Oedekoven. Distance Sampling: Methods and Applications. Springer, 2015.
N. L. Carr, A. R. Rodgers, S. R. Kingston, P. N. Hettinga, L. M. Thompson, J. L. Renton, and P. J. Wilson. Comparative woodland caribou population surveys in Slate Islands Provincial Park, Ontario. 1, pages 205–217, Mar. 2012. ISSN 1890-6729. doi: 10.7557/2.32.2.2270. URL https://septentrio.uit.no/index.php/rangifer/article/view/2270.
D. Chabot and C. M. Francis. Computer-automated bird detection and counts in high-resolution aerial images: a review. Journal of Field Ornithology, 87(4):343–359, 2016. ISSN 1557-9263. doi: 10.1111/jofo.12171. URL https://onlinelibrary.wiley.com/doi/abs/10.1111/jofo.12171.
K. S. Christie, S. L. Gilbert, C. L. Brown, M. Hatfield, and L. Hanson. Unmanned aircraft systems in wildlife research: current and future applications of a transformative technology. Frontiers in Ecology and the Environment, 14(5):241–251, June 2016. ISSN 1540-9295. doi: 10.1002/fee.1281. URL https://esajournals.onlinelibrary.wiley.com/doi/full/10.1002/fee.1281.
L.-P. Chrétien, J. Théau, and P. Ménard. Wildlife Multispecies Remote Sensing Using Visible and Thermal Infrared Imagery Acquired from an Unmanned Aerial Vehicle (UAV). ISPRS – International Archives of the Photogrammetry, Remote Sensing and Spatial Information Sciences, XL-1/W4:241–248, Aug. 2015. ISSN 2194-9034. doi: 10.5194/isprsarchives-XL-1-W4-241-2015. URL http://www.int-arch-photogramm-remote-sens-spatial-inf-sci.net/XL-1-W4/241/2015/.
L.-P. Chrétien, J. Théau, and P. Ménard. Visible and thermal infrared remote sensing for the detection of white-tailed deer using an unmanned aerial system: Detection of White-tailed Deer Using an UAS. Wildlife Society Bulletin, 40(1):181–191, Mar. 2016. ISSN 19385463. doi: 10.1002/wsb.629. URL http://doi.wiley.com/10.1002/wsb.629.
P. Conn, J. Ver Hoef, B. McClintock, E. Moreland, J. London, M. Cameron, S. Dahle, and P. Boveng. Estimating multispecies abundance using automated detection systems: ice-associated seals in the Bering Sea. Methods Ecol Evol, 5(12):1280–1293, Dec. 2014. ISSN 2041210X. doi: 10.1111/2041-210X.12127. URL http://doi.wiley.com/10.1111/2041-210X.12127.
C. Deuker and U. Franke. EStimator for Aerial Imagery. Density estimation for Wildlife Monitoring using vertical imagery in aerial Field research. 2015. URL https://sciencesocial.net
P. Enggist-Diiblin and P. Ingold. Modelling the impact of different forms of wildlife harassment, exemplified by a quantitative comparison of the effects of hikers and paragliders on feeding and space use of chamois Rupicapra rupicapra. wbio, 9(4):37–45, Mar. 2003. ISSN 0909-6396, 1903-220X. doi: 10.2981/wlb.2003.006. URL https://bioone.org/journals/Wildlife-Biology/volume-9/issue-4/wlb.2003.006/Modelling-the-impact-of-different-forms-of-wildlife-harassment-exemplified/10.2981/wlb.2003.006.full.
U. Franke, B. Goll, U. Hohmann, and M. Heurich. Aerial ungulate surveys with a combination of infrared and high–resolution natural colour images. Animal Biodiversity and Conservation, 35(2):285–293–293, 2012. ISSN 2014-928X. doi: 259214. URL https://www.raco.cat/index.php/ABC/article/view/259214.
A. Frid and L. Dill. Human-caused disturbance stimuli as a form of predation risk. Conserv. Ecol., 6(1):11, June 2002. ISSN 1195-5449.
H. Gander and P. Ingold. Reactions of male alpine chamois Rupicapra r. rupicapra to hikers, joggers and mountainbikers. Biological Conservation, 79(1):107–109, Jan. 1997. ISSN 0006-3207. doi: 10.1016/S0006-3207(96)00102-4. URL http://www.sciencedirect.com/science/article/pii/S0006320796001024.
R. M. A. Gill, M. L. Thomas, and D. Stocker. The Use of Portable Thermal Imaging for Estimating Deer Population Density in Forest Habitats. The Journal of Applied Ecology, 34(5):1273, Oct. 1997. ISSN 00218901. doi: 10.2307/2405237. URL https://www.jstor.org/stable/2405237?origin=crossref.
J. Hamr. Disturbance Behaviour of Chamois in an Alpine Tourist Area of Austria. Mountain Research and Development, 8(1):65–73, 1988. ISSN 0276-4741. doi: 10.2307/3673407. URL http://www.jstor.org/stable/3673407.
K. J. Havens and E. J. Sharp. Thermal Imaging Techniques to Survey and Monitor Animals in the Wild: A Methodology. Elsevier, London, 2016. ISBN 978-0-12-803384-5. doi: 10.1016/C2014-0-03312-6. URL https://linkinghub.elsevier.com/retrieve/pii/C20140033126.
A. Hodgson, D. Peel, and N. Kelly. Unmanned aerial vehicles for surveying marine fauna: assessing detection probability. Ecol Appl, 27(4):1253–1267, June 2017. ISSN 10510761. doi: 10.1002/eap.1519. URL http://doi.wiley.com/10.1002/eap.1519.
T. Hollings, M. Burgman, M. van Andel, M. Gilbert, T. Robinson, and A. Robinson. How do you find the green sheep? A critical review of the use of remotely sensed imagery to detect and count animals. Methods in Ecology and Evolution, 9(4):881–892, Apr. 2018. ISSN 2041-210X. doi: 10.1111/2041-210X.12973. URL https://besjournals.onlinelibrary.wiley.com/doi/full/10.1111/2041-210X.12973.
S. Jayakody, A. M. Sibbald, I. J. Gordon, and X. Lambin. Red deer Cervus elephus vigilance behaviour differs with habitat and type of human disturbance. Wildlife Biology, 14(1):81–91, Mar. 2008. ISSN 0909-6396. doi: 10.2981/0909-6396(2008)14[81:RDCEVB]2.0.CO;2. URL http://www.bioone.org/doi/abs/10.2981/0909-6396(2008)14[81:RDCEVB]2.0.CO;2.
J. Kilburn. Spatial Variability in Abundance, Detectability and Survival of White-Tailed Deer Across a Heterogeneous Landscape of Fear. PhD thesis, University of Connecticut, Storrs, 2018.
R. E. Kissell and S. K. Nimmo. A technique to estimate white-tailed deer Odocoileus virginianus density using vertical-looking infrared imagery. wbio, 17(1):85–92, Mar. 2011. ISSN 0909-6396, 1903-220X. doi: 10.2981/10-040. URL https://bioone.org/journals/Wildlife-Biology/volume-17/issue-1/10-040/A-technique-to-estimate-white-tailed-deer-span-classgenus-speciesOdocoileus/10.2981/10-040.full.
A. S. Laliberte and W. J. Ripple. Automated Wildlife Counts from Remotely Sensed Imagery. page 11, 2003.
M. A. LaRue, S. Stapleton, and M. Anderson. Feasibility of using high-resolution satellite imagery to assess vertebrate wildlife populations. Conservation Biology, 31(1):213–220, Feb. 2017. ISSN 0888-8892. doi: 10.1111/cobi.12809. URL https://onlinelibrary.wiley.com/doi/full/10.1111/cobi.12809.
T. A. Marques, L. Thomas, S. G. Fancy, and S. T. Buckland. Improving Estimates of Bird Density Using Multiple Covariate Distance Sampling. Auk, 124(4):1229, 2007. ISSN 0004-8038, 1938-4254. doi: 10.1642/0004-8038(2007)124[1229:IEOBDU]2.0.CO;2. URL https://academic.oup.com/auk/article/124/4/1229-1243/5147690.
J. Martin, H. H. Edwards, M. A. Burgess, H. F. Percival, D. E. Fagan, B. E. Gardner, J. G. Ortega-Ortiz, P. G. Ifju, B. S. Evers, and T. J. Rambo. Estimating Distribution of Hidden Objects with Drones: From Tennis Balls to Manatees. PLOS ONE, 7(6):e38882, June 2012. ISSN 1932-6203. doi: 10.1371/journal.pone.0038882. URL https://journals.plos.org/plosone/article?id=10.1371/journal.pone.0038882.
D. L. Miller, M. L. Burt, E. A. Rexstad, and L. Thomas. Spatial models for distance sampling data: recent developments and future directions. Methods in Ecology and Evolution, 4(11):1001–1010, 2013. ISSN 2041-210X. doi: 10.1111/2041-210X.12105. URL https://besjournals.onlinelibrary.wiley.com/doi/abs/10.1111/2041-210X.12105.
D. L. Miller, E. Rexstad, L. Thomas, L. Marshall, and J. L. Laake. Distance Sampling in R. bioRxiv, page 063891, Nov. 2017. doi: 10.1101/063891. URL https://www.biorxiv.org/content/10.1101/063891v2.
D. L. Miller, E. Rexstad, L. Thomas, L. Marshall, and J. L. Laake. Distance Sampling in R. J. Stat. Soft., 89(1), 2019. ISSN 1548-7660. doi: 10.18637/jss.v089.i01. URL http://www.jstatsoft.org/v89/i01/.
T. L. Millette, D. Slaymaker, E. Marcano, C. Alexander, and L. Richardson. AIMS-THERMAL – A thermal and high resolution color camera system integrated with GIS for aerial moose and deer census in northeastern Vermont. Alces: A Journal Devoted to the Biology and Management of Moose, 47(0):27–37, June 2011. ISSN 2293-6629. URL http://alcesjournal.org/index.php/alces/article/view/52.
D. P. Paine and J. D. Kiser. Aerial photography and image interpretation. John Wiley & Sons, Hoboken, NJ, USA, 3 edition, 2003. ISBN 978-0-470-87938-2.
M. D. Samuel, E. O. Garton, M.W. Schlegel, and R. G. Carson. Visibility Bias during Aerial Surveys of Elk in Northcentral Idaho. The Journal of Wildlife Management, 51(3):622, July 1987. ISSN 0022541X. doi: 10.2307/3801280. URL https://www.jstor.org/stable/3801280?origin=crossref.
K. A. Schoenecker, P. F. Doherty, J. S. Hourt, and J. P. Romero. Testing infrared camera surveys and distance analyses to estimate feral horse abundance in a known population. Wildl. Soc. Bull., 42(3):452–459, Sept. 2018. ISSN 19385463. doi: 10.1002/wsb.912. URL http://doi.wiley.com/10.1002/wsb.912.
A. C. Seymour, J. Dale, M. Hammill, P. N. Halpin, and D. W. Johnston. Automated detection and enumeration of marine wildlife using unmanned aircraft systems (UAS) and thermal imagery. Scientific Reports, 7:45127, Mar. 2017. ISSN 2045-2322. doi: 10.1038/srep45127. URL https: //www.nature.com/articles/srep45127.
A. M. Sibbald, R. J. Hooper, J. E. McLeod, and I. J. Gordon. Responses of red deer (Cervus elaphus) to regular disturbance by hill walkers. Eur J Wildl Res, 57(4):817–825, Aug. 2011. ISSN 1612-4642, 1439-0574. doi: 10.1007/s10344-011-0493-2. URL http://link.springer.com/10.1007/s10344-011-0493-2.
Z. Tablado and L. Jenni. Determinants of uncertainty in wildlife responses to human disturbance: Modulators of wildlife response to recreation. Biol Rev, 92(1):216–233, Feb. 2017. ISSN 14647931. doi: 10.1111/brv.12224. URL http://doi.wiley.com/10.1111/brv.12224.
P. A. Terletzky and R. D. Ramsey. Comparison of three Techniques to Identify and Count Individual Animals in Aerial Imagery. JSIP, 07(03):123–135, 2016. ISSN 2159-4465, 2159-4481. doi: 10.4236/jsip.2016.73013. URL http://www.scirp.org/journal/doi.aspx?DOI=10.4236/jsip.2016.73013.
D. Wang, Q. Shao, and H. Yue. Surveying Wild Animals from Satellites, Manned Aircraft and Unmanned Aerial Systems (UASs): A Review. Remote Sensing, 11(11):1308, Jan. 2019. doi: 10.3390/rs11111308. URL https://www.mdpi.com/2072-4292/11/11/1308.
P. J. Williams, M. B. Hooten, J. N. Womble, and M. R. Bower. Estimating occupancy and abundance using aerial images with imperfect detection. Methods in Ecology and Evolution, 8(12):1679–1689, 2017. ISSN 2041-210X. doi: 10.1111/2041-210X.12815. URL https://besjournals.onlinelibrary.wiley.com/doi/abs/10.1111/2041-210X.12815.
S. N. Wood and N. H. Augustin. GAMs with integrated model selection using penalized regression splines and applications to environmental modelling. Ecological Modelling, 157 (2):157–177, Nov. 2002. ISSN 0304-3800. doi: 10.1016/S0304-3800(02)00193-X. URL http://www.sciencedirect.com/science/article/pii/S030438000200193X.
Y. Yamaura, J. Andrew Royle, K. Kuboi, T. Tada, S. Ikeno, and S. Makino. Modelling community dynamics based on species-level abundance models from detection/nondetection data: Multispecies abundance model. Journal of Applied Ecology, 48(1):67–75, Feb. 2011. ISSN 00218901. doi: 10.1111/j.1365-2664.2010.01922.x. URL http://doi.wiley.com/10.1111/j.1365-2664.2010.01922.x.
B. G. Young, D. J. Yurkowski, J. B. Dunn, and S. H. Ferguson. Comparing infrared imagery to traditional methods for estimating ringed seal density. Wildlife Society Bulletin, 43(1):121–130, Mar. 2019. ISSN 1938-5463. doi: 10.1002/wsb.958. URL https://wildlife.onlinelibrary.wiley.com/doi/abs/10.1002/wsb.958.